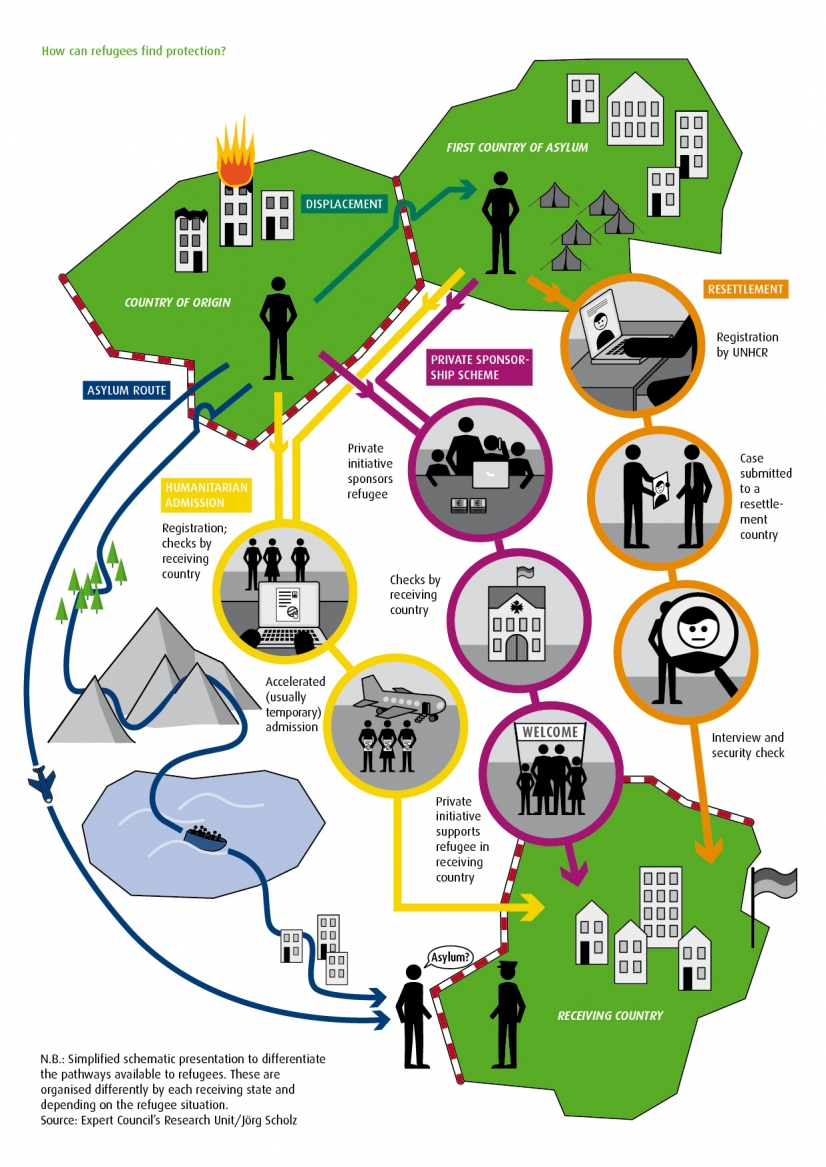
Resettlement has long been an important mechanism for refugee protection, and one that promotes international solidarity and durable solutions. In recent years and against a background of large-scale global displacement, the potential of resettlement to provide solutions for the worsening global refugee situation has been debated. The relationship between resettlement and territorial asylum as well as the potential of alternative forms of refugee intake, such as humanitarian admission or private sponsorship, have also been on the agenda – as illustrated in this infographic and discussed in a recent policy brief by the Research Unit of the Expert Council of German Foundations on Integration and Migration.
How many refugees benefit from resettlement each year? Which countries accept the largest numbers of resettled refugees?
These would seem to be straightforward questions with straightforward answers to them. But resettlement statistics harbour a number of uncertainties and pitfalls that are not immediately evident to most readers.
To answer the questions: in 2017, more than 75,000 refugees were resettled, and the United States, Canada and Australia were the top receiving countries for resettlement. Or were they? These are the figures you are likely to see in most documents and articles on refugee resettlement. They are based on data by the United Nations High Commissioner for Refugees (UNHCR), which in its
online database offers the most comprehensive, publicly accessible source of comparable global data on resettlement.
Taking a closer look at the figures, readers should be aware of at least five possible pitfalls:
Submissions vs. departures: This is a crucial distinction to understand UNHCR resettlement data. Submissions are the number of cases of individuals whom UNHCR considers in need of resettlement and whom it has proposed to a resettlement state for consideration. In the end, the decision over whom to resettle lies exclusively with the country of resettlement. Departures, by contrast, denote just that: how many individuals have travelled to their resettlement country in any given year.
So when we say that 75,000 people were resettled in 2017, what we are really saying is that 75,000 case files were submitted by UNHCR. In fact, a much smaller number, about 65,000 people, actually got on a plane and travelled to their new country.
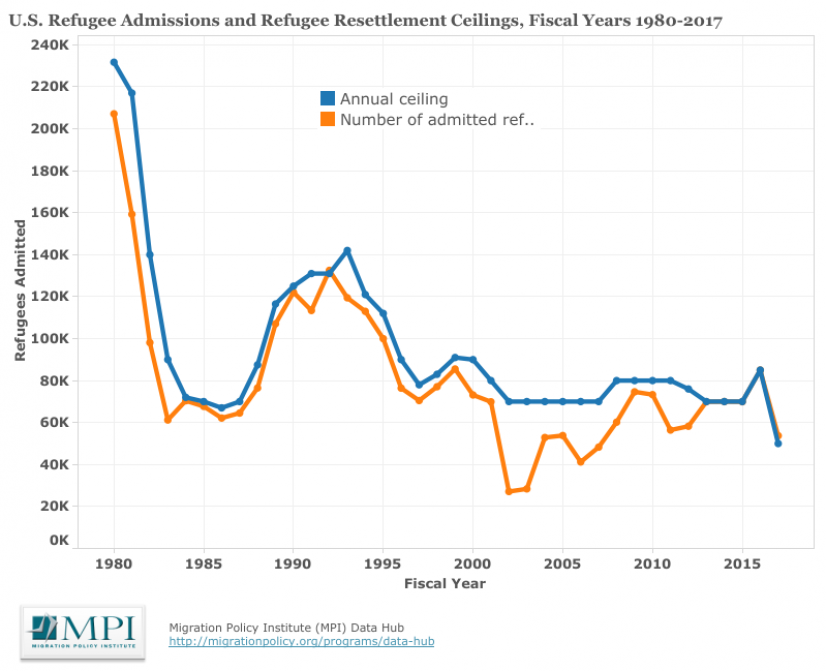
Announced vs. actual quotas: In the United States (US), traditionally the largest resettlement country, the government announces annual quotas for the number of resettled refugees to be admitted and reports on the de facto number of arrivals. Typically, annual ceilings and actual arrivals of resettled refugees track each other closely, as this graph illustrates.
But on occasion the differences can be stark: in 2002, for example, the announced quota for the US was 70,000 but only 27,000 arrived. This example demonstrates the extent to which resettlement quotas are subject to political events: In 2002 the US immigration system seized up after the 9/11 attacks. The recent announcement by the Trump Administration to cut resettlement quotas is another sign of their volatility.
Fiscal vs. calendar year reporting: In 2017, again, UNHCR reported 26,782 submissions and 24,559 departures to the US. However, according to US data there was a total of 53,716 resettlement admission that year, even exceeding its announced quota. What might explain this discrepancy?
In this case, part of the explanation lies in a basic statistical pitfall: UNHCR uses calendar years and the US uses the fiscal year (from October to September). Correcting for this factor reduces the gap between the US and UNHCR data significantly.
There is another reason, however. Not all resettlement is organised through UNHCR submissions. Instead, many countries use other or additional channels to choose resettlement candidates: refugees may be proposed for resettlement by international NGOs, for example, or through embassies abroad. These numbers do not appear in the UNHCR data set.
Things are also complicated in the European Union (EU), which collectively and through its Member States is becoming an increasingly bigger player in resettlement. EUROSTAT counts resettlement cases as they are reported to the agency by each Member State. This includes resettlement that takes place through national programmes as well as through joint European programmes. Notably, the comparability of different national programmes is not verified: What resettlement looks like and what it entails in terms of rights and standards can differ substantially between Member States. The European Commission, by contrast, tends to report on the fulfilment of quotas within EU-wide programmes only, such as the EU Resettlement Programme 2015-17 or its new edition that runs between 2017 and 2019.
And lastly, of course, a resettlement statistic offers only a partial view of the bigger picture on refugees globally or in any particular country. Absolute numbers may put the US at the top of the list of resettlement countries; however, per capita of its population Monaco resettled the largest number of refugees in 2017. Resettlement does also not reflect other forms of admission, principally territorial asylum. The EU-28 resettled barely 24,000 resettled refugees in 2017. However, that figure must be put in perspective of half a million positive asylum decisions taken in the EU that same year. And lastly, whatever statistics you use, resettlement is still dwarfed by the numbers of refugees hosted by several states in proximity to conflict regions such as Turkey, Pakistan and Uganda, the top three refugee host countries in 2017.
EUROSTAT news releases 67/2018 Asylum decisions in the EU. EU Member States granted protection to more than half a million asylum seekers in 2017 (19 April 2018).
European Commission 2018: Annex 4 to the Progress Report on the Implementation of the European Agenda on Migration. Resettlement.
Disclaimer: The opinions expressed in this blog are those of the author and do not necessarily reflect the views of the International Organization for Migration (IOM). The designations employed and the presentation of material throughout the blog do not imply the expression of any opinion whatsoever on the part of IOM concerning the legal status of any country, territory, city or area, or of its authorities, or concerning its frontiers and boundaries.


