Migrant integration
Migrant integration has gained prominence on the global agenda with the advent of the 2030 Sustainable Development Agenda’s call to “leave no one behind”—including migrants. The field of migrant integration, however, has traditionally been polarizing and related data are generally limited to high-income countries. The increased interest in migrant integration highlights the need for more research and better data.
Integration cuts across different policies and various aspects of migrants’ lives and therefore data on migrant integration cover a wide range of information, including whether migrants are integrating into the economic, social, cultural, and political spheres of society, the discrimination they face, how policies affect migrants’ inclusion, and how the public perceives migrants and immigration.
Definition
Definition
There is no consensus on a single definition for integration. Definitions share commonalities, but remain highly context or country specific. Nevertheless, migrant integration may be broadly defined as:
- The process by which migrants become accepted into society, both as individuals and as groups….[Integration] refers to a two-way process of adaptation by migrants and host societies…[and implies] consideration of the rights and obligations of migrants and host societies, of access to different kinds of services and the labour market, and of identification and respect for a core set of values that bind migrants and host communities in a common purpose (IOM, 2011).
Related concepts include social inclusion and social cohesion. Social inclusion refers to migrants’ inclusion and full economic, social, cultural, and political participation into host communities. Social cohesion refers to concepts such as anti-discrimination, countering xenophobia and promoting mutual understanding (IOM, 2017).
Integration occurs in the public and private realms, across generations, and at the individual, family, community and national levels (EU Council, 2004). Some typical indications of successful migrant integration are the decrease of the differences between migrants and non-migrants according to data on employment, education, health and social inclusion, among other areas.
Key trends
It is difficult to identify a trend on migrant integration at the global level in part because research on the topic is recent and has largely been limited to high-income countries or regions. For example, more robust research exists for countries in the Organisation for Economic Co-Operation and Development (OECD). Research on OECD countries shows that migrants in most countries have on average worse outcomes than the native-born population in areas such as education attainment and labour market participation (OECD, 2015). This is interpreted as a sign of persisting barriers to effective integration. Integration outcomes depend on many factors including the country of origin, the host community context and the skill level of immigrants. Integration tends to improve with the duration of residence in most countries according to available data (OECD, 2015; Huddleston et al., 2013).
Data sources
The main sources for migrant integration data are censuses and household surveys, particularly labour force surveys and living conditions surveys. These sources contain data that can be used to measure migrant integration across a range of areas. Key areas include:
- Labour market (for example, employment rates, wages or income, occupation, activity rate and over qualification rate);
- Education (for example, highest level of education attainment, dropout rate, grades and skills);
- Health (for example, healthy life years and life expectancy);
- Social inclusion (for example, property ownership, housing cost overburden, child poverty and social exclusion)
- Civic inclusion/engagement (for example, voting rights, representation in the political arena, public employment, naturalization rate, share of long-term residence and volunteering);
- Cultural inclusion (for example, customs, traditions, language and religion);
- Financial inclusion (for example, banking, savings, credit, insurance and advice);
- Spatial inclusion (for example, residential segregation by socio-economic status);
- Public opinion (for example, ability to integrate highly heterogeneous and culturally diverse group of people); and
- Role of media (for example, inclusion and diversity in public service media).
(Eurostat, 2011; Huddleston et al., 2013; Cities of Migration, 2010 and OECD, 2015)
Administrative sources also provide information such as citizenship and long-term residence status, which can indicate migrants’ civic engagement and political participation.
Public opinion polls or surveys are additional sources that measure attitudes of host societies towards immigration (IOM, 2015). For example, the Gallup World Poll also provides insight into people’s views on immigration. Among the questions the Poll asks people are whether immigration levels should change in their countries and whether they think immigrants mostly take jobs that citizens do or do not want. Analysis and findings from these Gallup World Poll questions are presented in IOM’s report How the World Views Migration. In addition, My city of Migration (MyCOM) is a diagnostic web app that uses simple scenarios to evaluate the level of inclusion in five modules: as a new arrival, at school, at work, in health and on election day. Based on these modules, the MyCOM diagnostic tool provides elaborate information on “my” city’s diversity and inclusion.
Surveys of migrants’ experiences or sometimes field experiments also measure discrimination, an obstacle for migrant integration (EU-MIDIS, 2015; Heath et al. 2013; MPG 2011).
Additional data sources include studies and indices that measure migrant integration policies by comparing the laws that govern migrant integration across countries (Huddleston et al., 2015).
Several specific sources have consolidated and analyzed data on migrant integration at the global or regional level. Some examples include:
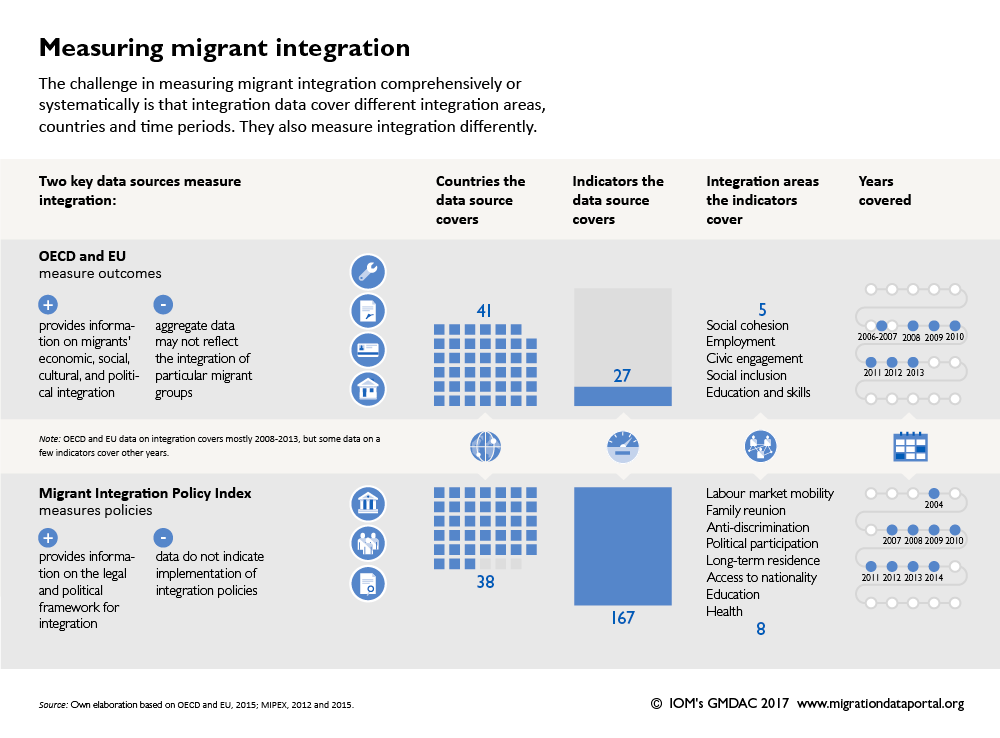
- The European Commission and OECD consolidated data on key integration indicators across all European Union (EU) and OECD countries, with a focus on third country nationals in the European Union, and young people with an immigrant background.
- Eurostat examined survey data on migrant’s employment, education, social inclusion and civic participation to compare integration across EU countries.
- The Migration Integration Policy Index (MIPEX) measures migrant integration policies across EU Member States, Australia, Canada, Iceland, Japan, Republic of Korea, New Zealand, Norway, Switzerland, Turkey and the United States.
- The Migration Governance Indicators (MGI), which provides a framework for countries’ migration governance, assesses the performance of almost 40 countries across 6 dimensions of IOM’s Migration Governance Framework, of which one relates to socio-economic well-being of migrants.
- IOM’s 2013 World Migration Report presents Gallup World Poll data on migrants’ well-being in over 150 countries, and provides information on migrant integration in low-income countries, an understudied area.
- International Migration, Integration and Social Cohesion (IMISCOE) is Europe’s network of scholars in the domain of migration, integration and diversity studies. It plays crucial role in building a bridge between researchers, policymakers and civil society organisations by bringing them together into the IMISCOE conference on an annual basis.
- The Centre on Migration, Policy, and Society (COMPAS) is a research centre that develops theory, produces knowledge, informs policy making/public debate and engages users of data in the field of migration. The migration-integration nexus is one of the core areas of research of COMPAS.
- The Migration Policy Institute’s National Centre on Immigrant Integration Policy is a platform for government officials, non-profit organizations, educators, journalists, researchers, local service providers and others, who seek to respond to the challenges and opportunities of immigrants’ integration in local communities the United States and Europe.
Data strengths & limitations
The international bodies or organisations and research community that have consolidated and analysed data at the global or regional level have substantially advanced the study of integration. These data allow for an understanding of how immigrants fare in high-income countries and have facilitated the exchange of good practices between countries.
However, data on migrant integration have the following limitations:
- Most international studies on migrant integration are based on national surveys. In some countries, immigrants are a small population. As a result, it is not always easy to ensure that data reflect characteristics of this particular group.
-
Available data on integration only cover a limited number of countries.
-
As with all international comparisons, concepts and definitions are not always standardised across countries. For example, countries may have different concepts of who counts as a migrant. In addition, the idea of what “successful” integration means varies from country to country.
- Relying on gaps between migrants and non-migrants as the key measurement of integration has drawbacks. For example, if the situation of nationals improves at a faster rate than that of migrants, integration may seem to worsen despite the fact that migrants are also doing better.
- Simple comparisons and neglecting that migrant discrimination may be based on more than being a migrant hide the fact that there are many factors influencing migrant integration. For example, a migrant may be discriminated against for being a migrant, and also on the basis of their sex/gender, religion, age or ethnicity, among others. Comparisons between countries are complex given that each country has its own policies and history of migration (Huddleston et al., 2013). Countries may host very diverse migrant communities and policies affecting integration may vary considerably.
- Although measuring migrant integration policies is informative, selected data and indices reflect policy priorities and choices about whether a policy is relevant to integration, and whether good integration policies actually lead to better outcomes for migrants. Some existing data sources, such as the Integrated Public Use Microdata Series (IPUMS), have been underused.
Further reading
2015 Indicators of immigrant integration 2015: Settling in. OECD
Publishing, Paris.
International Organization for Migration (IOM)
2015 How the world views migration. Global Migration Data Analysis
Centre, IOM, Berlin.
Eurostat
2011 Indicators of immigrant Integration: A Pilot Study. European Union,
Luxemburg.
Huddleston, T., Niessen, J., and Tjaden, J. D.
2013 Using EU indicators of immigrant integration. Final Report for
Directorate-General for Home Affairs. Brussels: European Commission.
Heath, A., T. Liebig and P. Simon
2013 Discrimination against Immigrants – measurement, incidence and
policy Instruments International Migration Outlook 2013, OECD Publishing,
Paris
Huddleston, T. et al.
2015 Migrant Integration Policy Index 2015. Migration Policy Group,
Brussels.
Juran, S. and S. Rachel
2016 The potential of the 2010 population and housing census round
for international migration analysis. Conference background paper,
Improving Data on International Migration Towards Agenda 2030 and the
Global Compact on Migration, IOM, Berlin.